Here’s Another Reason To Be Bullish On The Market In The Long-Run…
Recent research from the Federal Reserve left me with a familiar feeling that economic data always has a little bit of good news and a little bit of bad. As investors, it’s important to understand which one of those — the good or the bad — will drive the trend.
The research I saw noted that the percentage of retirees is rising sharply, and the pandemic seems to have accelerated that trend.

Source: St. Louis Federal Reserve
According to the Fed’s report…
The figure shows that the percentage of retirees in the U.S. population (the blue line) was relatively stable at around 15.5 percent until 2008 (the vertical dashed line). That year marked not only the beginning of the Great Financial Crisis but also when the oldest Baby Boomers, those born in 1946, turned 62 years of age and became eligible to receive Social Security retirement benefits. As Baby Boomers began retiring, the percentage of retirees in the U.S. population grew to 18.3 percent in February 2020, the eve of the COVID-19 outbreak. The percentage then increased at a much faster rate, reaching 19.3 percent in August 2021.
The red dashed line shows the expected trend. The difference between the blue and red lines is about 0.9%, representing more than 3 million extra retirements.
Many of them could be related to COVID-19. An estimated 5.3 million workers have left the labor force since the economy shut down in early 2020. Retirees will be difficult to coax back into the labor force, so it is possible that the labor shortage experienced by many employers will be a long-term problem.
That’s the bad news. Which means it’s time for the good.
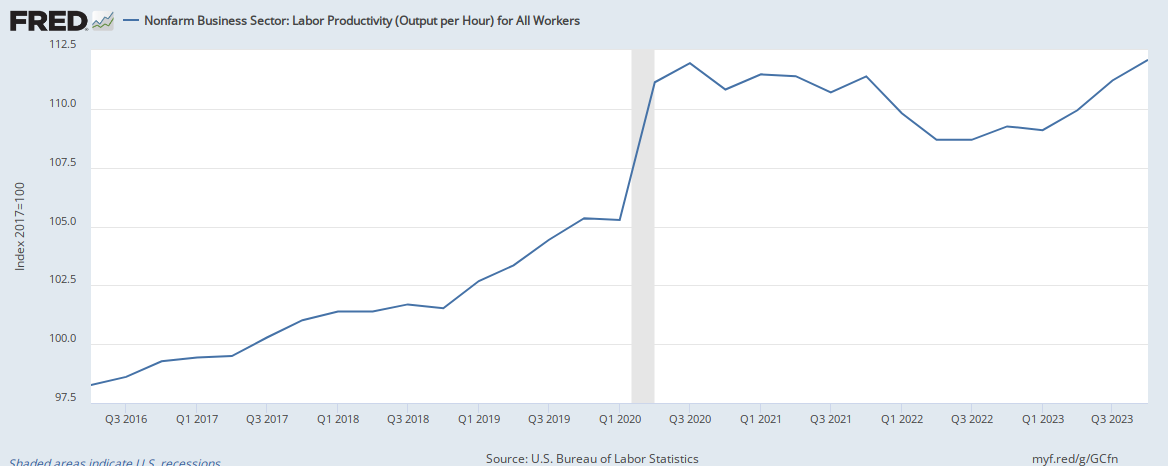
The good news is that productivity is rising, and the economy is producing as much as it did before the pandemic.

Source: Federal Reserve
How I’m Trading Right Now
This is all bullish for the stock market in the long run. Companies will deliver larger profit margins with higher productivity, and that means stocks should carry higher-than-average valuations.
[Related: Investors Are Feeling Bullish Again…]
Now, turning to the short term and reviewing SPDR S&P 500 ETF (NYSE: SPY), my indicators remain bullish.
My Income Trader Volatility (ITV) indicator is on a “buy” signal, with the indicator (red line) below its moving average (blue line) in the chart below.

As a reminder, ITV is the award-winning indicator I use to identify trades over at my premium Income Trader service. Without getting too deep into the details, for now, think of it as similar to the Volatility Index (VIX) — but for individual stocks.
This indicates we should see continued gains in SPY. My Profit Amplifier Momentum (PAM) indicator confirms that.

PAM is designed as a short-term indicator. It shows the rally is likely to continue this week, although a short-term pullback remains possible, and I consider that pullback to be likely.
[Related: The Broad Market Rally Looks Strong — Here’s How I’m Trading Right Now]
For the short term, based on my indicators, I remain bullish on the market right now. I will consider a pullback to be a buying opportunity.
That makes right now the perfect time to try the system we use for generating extra income over at Income Trader… Which is why we’re bringing back one of the most ambitious initiatives we’ve ever undertaken in the history of our company…
It’s called the Income Millionaire Project. And the goal of this program is simple: Show 1,000 regular investors how they could make thousands in extra income each month — without taking on extraordinary amounts of risk.
We’re talking about regular, instant cash payouts of $550… $770… $880… and even $1,105… And the best part is that you can do it over and over again. At will. Go here now to learn more.